Code Quality: Metrics That Matter
Written: Jan 11, 2015
It’s not old, it’s vintage.
This post was last updated some years ago and hasn’t been updated recently. Be aware that some of the content, tools, and techniques described may not be completely up-to-date.

As programmers, we spend a lot of time and bits debating and preaching about the merits of good code and the evils of bad code and the differences between the two. And as Rubyists, we sometimes get a little… What? Self-righteous? Precious about our code? Strong tendency to bikeshed?
OK, we’ve all probably been guilty of that at times. Most Ruby and Rails hackers I’ve worked with and known over the years show a lot of care and craft when it comes to their code, but we do it all in the service of building something that lasts. This is why we go on about skinny controllers and presenters versus helpers. It’s why we write tests. And it’s a big part of the motivation that has led to the creation of so many tools for evaluating source code quality. This article is going to talk about a few of them that I’ve found useful at various times.
But before we launch into that, there’s an important question that needs answering:
What are you gonna do about it?
No, seriously, that’s a real question.
If all you’re interested in is how to install the gems and run the reports, a bulleted list of links to the READMEs will do just fine. Before you invest any more time, I want you to think about what you’re expecting to learn from them and decide right now what you’ll do when you have that information. This is the piece that’s missing in a lot of the articles and tutorials I’ve seen about code quality tools, and that’s what I’m hoping you’ll be thinking about as you read on.
Code coverage
Coverage matters, but often not in the way people think. A lot of people think that well-covered means well-tested and that well-tested means correct. But just spend a moment thinking about those two statements and you’ll see that there are two big logical leaps in that thinking.
A lot of teams chase after 100% coverage for its own sake or as a seal of approval that they can show to a customer or manager, but there are legitimate reasons to work for high levels of test coverage on your projects. First and foremost is the fact that gaps in coverage are indicative of gaps in your development process. Looking for sections of code where coverage is missing can get you asking the right sorts of questions about why it happened.
- Was there something about that code that made it too hard to test?
- Is that section a candidate for refactoring?
- Does the person who wrote the code need some coaching or guidance to help them improve their testing technique?
Another reason that coverage is important, especially when it comes to Ruby applications, is because it gives certainty that code is executed under test. Why is that important? Because eventually, you’re going to need to update some part of the infrastructure that your application rests on - whether that’s the Ruby interpreter (13 releases in the past year), Rails (12 releases), or some other gem you rely on. When that day comes, having a test suite that covers most or all of your application will mean you don’t have to worry that something is going to blow up in production because of a deprecated method or API.
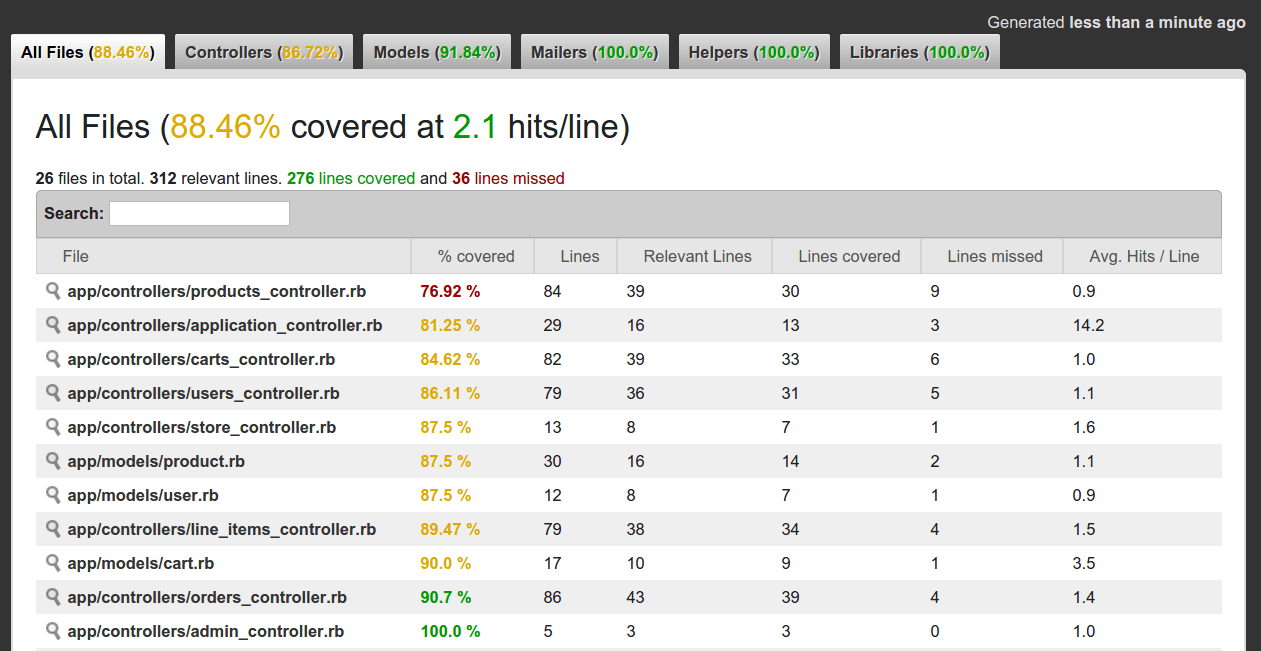
I use SimpleCov on on most non-toy projects to measure overall code coverage and to show me parts of the codebase that aren’t covered. It’s set up up in your test configuration so that it produces an updated report every time your test suite runs. Just set it, and forget it. (Well, more like set it, and check it every so often.)
Security
No computer system is completely secure, but if you’re shipping web applications as a lot of Ruby people are, you might as well hang a big “Hack me” sign on your web server. Most developers are completely, almost comically clueless about the kinds of security exploits they’re building into their applications every time they sit down and open an editor. But take the time to read through a basic guide or maybe a more comprehensive post on Rails security, and it will be enough to turn your hair white.
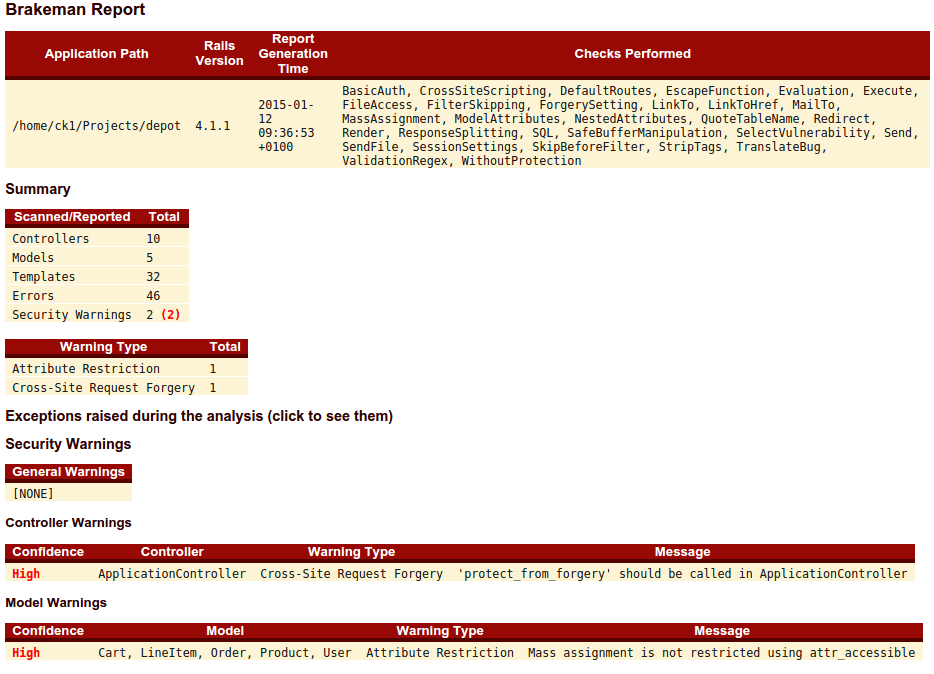
Brakeman is a static analysis scanner that searches your Rails code for potential security risks ranging from proper use of Rails security measures in your code to potential vulnerabilities to cross-site scripting, mass assignment, and other well-known types of attacks. The report summarizes all problem areas and summarizes them in a report that lets you know where you could be looking to make improvements. While it doesn’t provide any information about remediation, it gives you a good opportunity to educate yourself on these various types of risks while you’re in the process of covering your application in Kevlar.
Performance and efficiency
Everyone knows that performance is important, but it’s a quality factor that often gets ignored until after a feature (or sometimes a whole application) ships. Knowing where your application spends its time gives you insight into how you can make it faster. I’ve used New Relic in the past for active application profiling, and I’m currently using Scout on my main consulting project, but both of these are mainly priced for the enterprise and not individual developers and small companies.
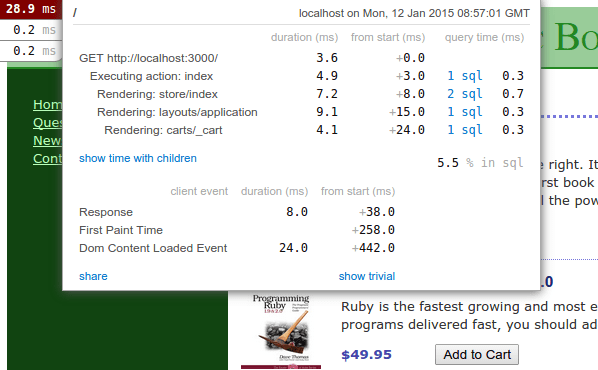
If you’re not already familiar with the rack-mini-profiler gem, you really should get to know it. You can drop it into your Rack application, and thereafter, you’ll have a small pop-up window in the corner of every page of your application that you can click for performance profiling information about the request that presented the page.
I’ve also heard good things about the Bullet gem which watches ActiveRecord for evidence of potential inefficient queries and coding around the database. Because it looks at the queries themselves and not the time it takes to run them, it should be a more objective measure that won’t be as prone to false negatives caused by, say, an unrealistically undersized development data set.
Style and complexity
As Rubyists, we care about appearance and style when it comes to our code. Unfortunately, there’s also a strong independent streak running through the community that’s convinced a lot of us that everyone’s coding style sucks except our own. But the fact is that style, and in particular having a unified style, matters in programming for a few reasons.
- Your code that should be read by other developers. (And “other developers” includes Future You.)
- Code must be unambiguous and not open to multiple interpretations. I swear, if I ever go mad, bet that it will be because of some screwy little error involving operator precedence or missing parentheses.
- We tend to write code on a small scale but understand it on a large scale. You need to make sure that the final product isn’t overly complex, and this can be measured and simplified using standard tools.
It took me a long time to try out Rubocop - in part, for some of the reasons cited above. The tool runs a bunch of different checks against my codebase and warns me if I’m doing something janky in four main areas.
- Style - code formatting, whitespace, comments, character case, etc.
- Lint - incorrect or ambiguous formatting and syntax, etc.
- Metrics - class and method length, complexity, nesting levels, number of parameters, etc.
- Rails - checks specific to the Rails API
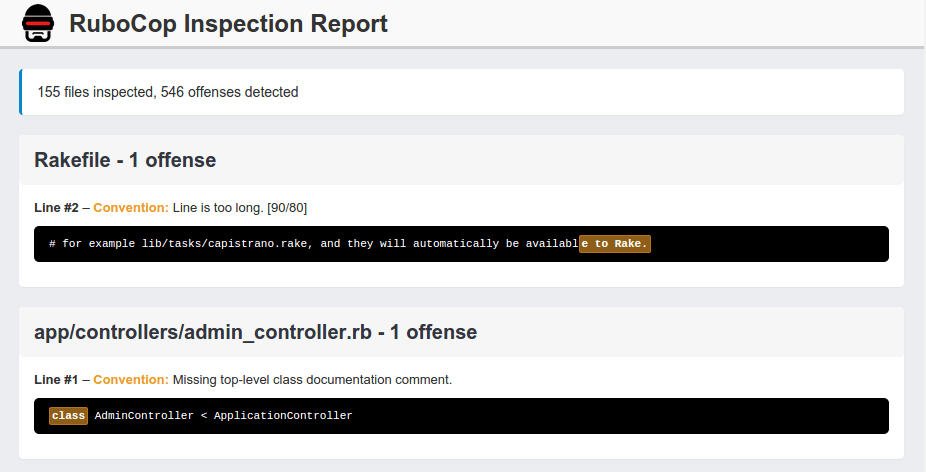
I’m still getting used to it, but being somewhat dilligent about using it and referring to the report on a semi-regular basis has helped me start working out some of the little peculiarities that have crept into my coding style over the years.
Lines of code? No, really.
Pointy-haired bosses have been using lines of code (LOC) as a proxy for programmer productivity since… probably since just after the first lines of code were written. And even though it’s been largely discredited, a lot of development shops still track and use this in performance evaluations because, frankly, it’s a really easy metric to collect and doesn’t require any interpretation.
The times when I’ve seen LOC used for anything but evil have been when looking at things like what Rails’ rake stats task provides. When taken as a high-level indicator of code complexity, especially with some context given as with “lines of code per something” or “lines of this versus lines of that”, it provides a good option to, say, nothing at all.
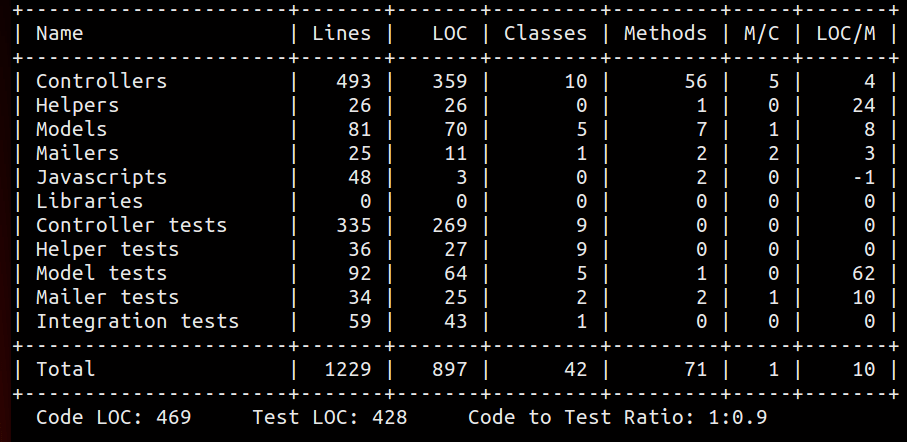
LOC is a really versatile metric. I’ve used it at various times to prioritize smaller tasks within a larger development project and to find places that might be in need of some refactoring into smaller units. The main problem with it, though, is that it really doesn’t tell you much on its own. It’s BYOC - Bring Your Own Context.
If you’re in a Rails project, you’ve got this already by running rake stats. If not, throw together an embarrassingly dead-simple little script like I did that will count total lines and LOC.
Metrics are there to make it easier, not to replace your instincts.
A word of caution: what they say about whatever gets measured gets optimized is true in my experience. When you’re using tools that are able to look at a large, complex codebase and boil its goodness or badness down to a single number of letter grade, it’s tempting to shut off the critical thinking part of your brain. When you do that, you’ve stopped writing programs for people and started writing them for other programs. Now there’s a depressing thought.
Don’t follow the numbers blindly. You know your code better than the tool does, but let the feedback they give you inform and influence your work to make it better.